Can a solution be found to obtain accurate end point to eliminate false cut offs caused by bunched cloths for a new clothes dryer product in development.

Background
Fisher & Paykel is developing a new dryer product that uses a thermistor in the exhaust duct of the dryer to detect the end of cycle. This is a well-used technology in the industry and the theory behind using a thermistor for end of cycle detection is well understood:
The ideal outlet temperature curve is the dark blue line in Fig 1, the temperature initially increases & then reaches a steady state. During steady state the Relative humidity (RH) of the air at the outlet is approx. 100% and the temperature does not increase as the air is absorbing as much moisture from clothes as possible.Towards the end of the cycle, as the clothes get close to completely dry, the RH drops and the outlet temp increases.
The point where the exhaust reaches < 100% RH is referred to a ‘critical moisture point’. By monitoring this increase in temperature at the exhaust, the dryer can automatically stop the cycle at a preset level of dryness. If desired we can stop with a specific remaining moisture level in the clothes (between 15-2%) depending on customer needs.
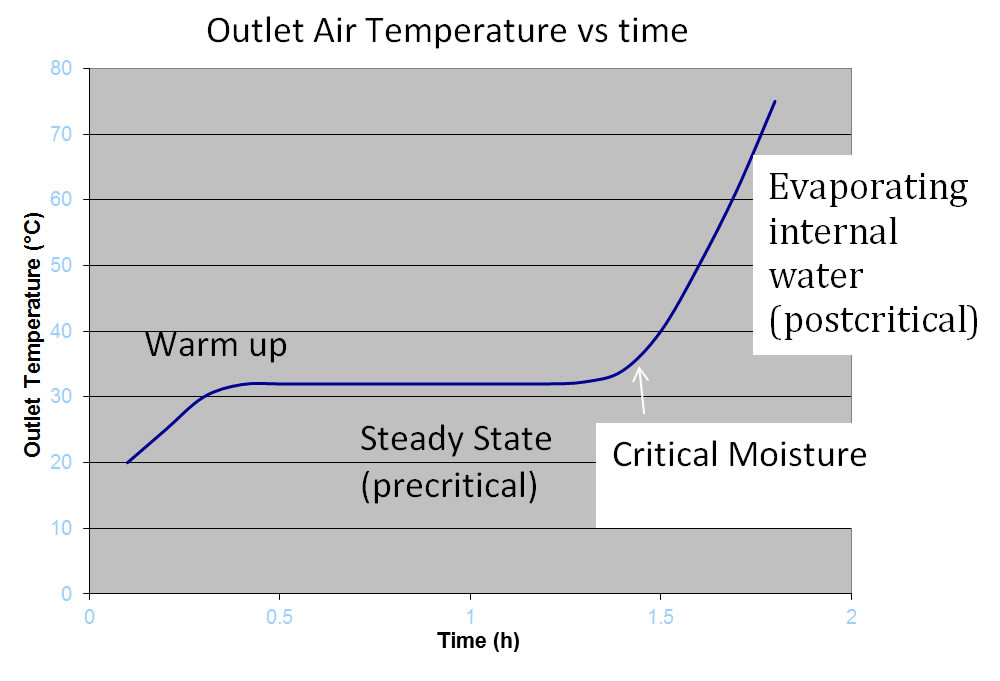
Figure 1. Ideal Exhaust Temperature Curve
Problem 1
- In reality the temperature exhaust curve does not look smooth due to clothes bunching and tumbling.
- The output temperature fluctuates around this ideal grey curve & often triggers an early stop as the outlet temp will exceed the limit and thus “false trigger” the end of cycle
- Temperatures can suddenly rise as the clothes bunch or tangle. The product will generally unbunch clothes when it reverses its tumbling direction, every 4min or 1 min depending on the preset cycle. Unbunching may not happen if the cycle stops early
- When this happens the customer is unhappy as there will be wet clothes still in the load
Goal
Suggest some solution to filter the data to get a more accurate end point & stop false triggers.
Minimize the delay due to filtering as this may over dry the clothes.
Notes:
- We know that due to the physics of the system there is a maximum limit on the rate of moisture extraction of the system, but we don’t put this to good use.
- We have 5 end points defined for end of cycle from damp dry, extra dry, customers value this depending on what they clothes type is, i.e. damp shirts are easier to iron or may prefer extra dry towels.
- We have test output data for a variety of load sizes and load types to analyze that illustrate this problem
- The curve can look very different for different load types and sizes, see Fig 2
- To generate our current end temperature limits we post process exhaust temperature data and apply a polynomial curve to the raw data. We don’t do any filtering in real-time in the product.
Drier Testing
- Select a clothes load of known "Bone-dry" weight.
- Wash this load, spin dry then put clothes in Dryer
- Start Dryer and record:
- Mass of Dryer + Clothes
- Temperature of Outlet Air
- Electrical Energy consumed
- Leapsed Time
- after the clothes reach 102% of their "Bone-dry" mass, stop test.
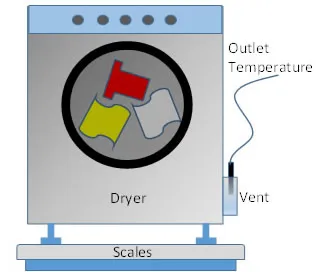
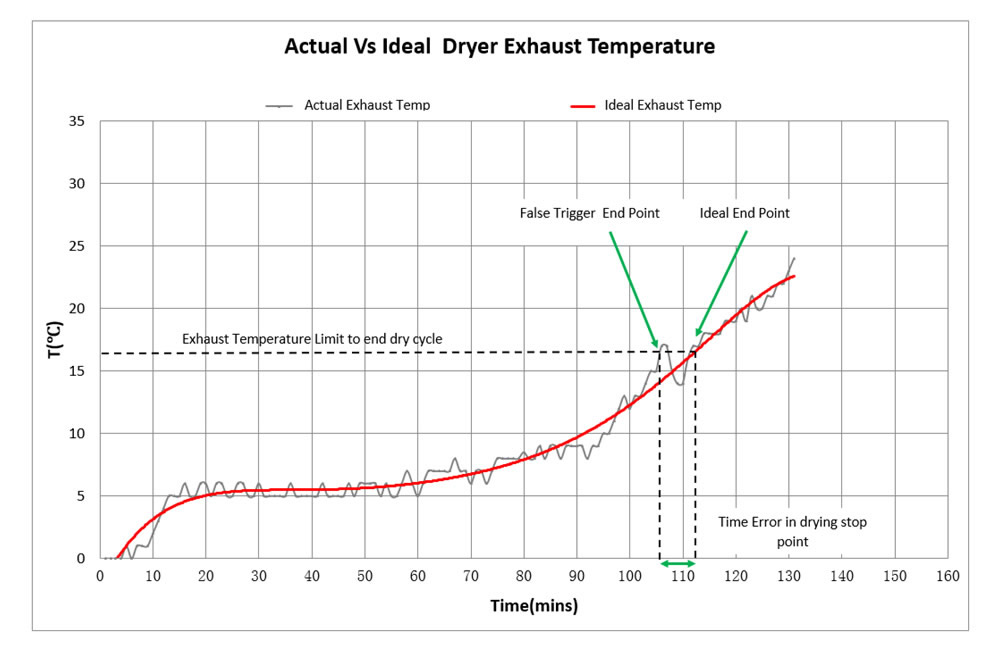
Figure 2. Ideal & Desired Exhaust Thermistor Curve
Background
To create end point limits for a new dryer product we do extensive empirical testing (see insert above) of each load type (delicate, heavy, cotton etc) and load size (1kg, 3kg, 6kg), 240+ tests, to generate a range of exhaust temperature output curves. We then compare the temperature output curves to the actual weight of the clothes as they are drying. We know the dry weight of the clothes and the wet weight at the start of the cycle.
As we can measure the change in weight (moisture removal) and the temperature output we can accurately measure during testing the exact moisture removed from the clothes. From this data we generate a limit curve that will stop the drying cycle at a specific moisture level by relating moisture remaining to output temperature. For delicate clothes of varying weights we have generated 5 curves that relate to moisture removal to temperature (sensitive data). We have mathematical simulation models for a vented dryer products but these don’t take account in any way for varying load types
Problem 2
- In our recent product cycle this resulted in approx. 6 months of testing to generate enough data to develop these curves, A curve is required for each load type and size
- We also repeat the testing on several machines to understand machine to machine variation
- After completing one of round of testing we needed to make a modification to the airflow of the product, which resulted in repeating this same testing as the increase in airflow affected the temperature curves significantly.
- Back in the 1980s when we designed our last automatic dryer went through this same process!
- The reason we do this extensive testing is we don’t understand the fundamental relationship between the dryer design factors, e.g. heating power, drum size, airflow, heat loss, clothes moisture transfer and how that affects temperature output.
Goal
Using existing collected data to understand the fundamental design factors and their effect on temperature output. So that, in the future, we can reduce the amount of testing required to just a few key test scenarios and then be able to generate all required curves for all load types and sizes.