Transmission line conductors - big data cleansing, probability of failure derivation and asset health relationship

Transpower is central to the New Zealand electricity industry, connecting New Zealanders to their power system through safe, smart solutions for today and tomorrow. As the grid owner, we reliably and efficiently transport electricity from generators to distributors and large users.
To achieve this, a core component of our transmission network consists of transmission line conductors which enable the flow of electricity. Our asset management approach for conductors seeks to achieve a high level of reliability at least whole-of-life cost. This is further supported by the regulatory environment that we operate in, which ensures that our investment decisions are closely scrutinised and approved by the Commerce Commission up to 7 years in advance of the work being carried out.
There are approximately 12,000 route kilometres1 of transmission line conductors along with numerous fittings such as conductor joints. Despite the large numbers of components in service, the reliability of conductors is high, and failures2 are rare. The 10-year average rate of conductor drop incidents resulting from failures of conductors is approximately 2 events each year, based on records which go back to 1998. Most incidents are caused by mechanical failure of in-span joints, of which we have around 100,000 installed on the system. Therefore, the annual failure rate is closer to 2 x 10⁻⁵. Most joint failures are due to poor installation practices. Conductor failure may lead to loss of electricity supply and could cause serious physical harm to any people or objects underneath the conductor.
1 Route length is the end-to-end distance traversed by the line; circuit length is the total length of the circuits carried on the line (for example, a double circuit line of 100 route km will be a 200 circuit-km line).
2 Conductor failure is defined as the mechanical failure of the conductor and its components resulting in conductor drop.
We are conscious that joint failure, whilst presently the leading cause of failures, is not the only reason that conductors drop. We are also conscious that we have an aging conductor asset base, which is degrading in condition and performance as time goes by. Indeed, we have a concern that there may be a so called "wall of wire" coming towards us, whereby the ever-aging conductor starts to be the primary cause of failure over coming years.
Degradation of conductor condition, hence life expectancy, depends primarily on the corrosiveness of the local atmosphere, but also on the construction (such as whether they have been greased to protect against corrosion) and the conductor material. Typical conductor types are Aluminium-Conductor Steel Reinforced (ACSR) and All Aluminium Alloy Conductors (AAAC).
To date, we have reduced conductor failures by means of monitoring and repairing, or replacing, where we judge that they are nearing their end of life (EoL). This is deemed to be the point whereby they have lost electrical performance capabilities or mechanical strength, with our designated nominal EoL factors being 15% loss of aluminium cross section, or 20% loss of strength. However, ground-based and structure-based visual assessments are of very limited use in predicting conductor end of life in a timely manner. This is because degradation (corrosion, fatigue, fretting) generally begins on the inside of the conductor, so is invisible until well advanced. Even detecting white corrosion product or small bulges is extremely difficult from the ground when looking up into the sky.
For long term expenditure forecasting, we currently have a very simplistic asset health model to predict conductor end of life, which considers the known factors in appointing a base life and additional life extension or reduction durations to identify an expected life. However, there is limited understanding of the different timeframes associated with each of the factors in different environments or for different conductor constructions, and therefore a wide tolerance on the accuracy of the asset health and EoL prediction.
We are currently embarking on an improvement journey where we are adopting a risk based asset health modelling approach, which considers factors such as age, corrosive environment, conductor construction to assign an asset health index (or score) against each section of conductor. This is nominally a proxy for the EoL calculations, but is to be used only for medium to long term (5-15yr) planning. Ultimately, we would like to be able to calculate each conductor's probability of failure based on their asset health index. This information can then be used to model the monetised network risk.
We are a long way from this goal, although in many ways, ahead of most of our peers internationally who are either not quite facing the same challenges as we are in NZ (which is prone to highly corrosive environments), or operate in a different (unregulated) market which allows them to make investment decisions under a different set of rules.
The end goal of this challenge is to develop a method for calculating conductor probability of failure at each asset health index score. We currently propose the following stages in approaching this problem:
Data Available:
- Maintenance and project records of work undertaken on conductors. Database size: 109,386 x 30 matrix, 24.4MB.
- Asset information on conductor age, type, corrosive environment factor, condition scores, length and electrical loading.
Problem Specification
Our historical maintenance and project records (which can identify situations where we have avoided a conductor drop by repairing or replacing it), contain both textual and numerical information. Ideally we would convert this information to a structured format to identify
trends/rates of defects or failures by type or region or condition or age, etc. This would be extremely difficult and time-consuming to do manually.
Desired Outcome
Create a mathematical model using a few example textual and numerical inputs for "learning" (e.g. machine learning or neural networks method) to output a structured data set from our maintenance and project records, which can then be used to derive number of defects or failures. The model would be customisable so that the inputs could change to assess different types of defects or failures. The identification of an estimated level of accuracy is also desirable.
Data Available
- Converted maintenance and project records to a structured format identifying types of defects/failures – from Stage 1 or alternatively use "dummy" data if Stage 1 is unsuccessful
- Failure event records
Asset information on conductor age, type, corrosive environment factor, condition scores, length and electrical loading. Database size: 52,890 x 41 matrix, 10MB.
Problem Specification
Historically, our conductors' asset class has been very reliable, resulting in very few failures. As such, it is difficult to derive an age based probability of failure with high statistical confidence. However, this is mainly due to our diligence in addressing defects, as part of our project and maintenance work, prior to failure. Whilst we address defects based on their risk (e.g. anticipated likelihood to result in a failure and location or electrical loading), this is presently a subjective activity, reliant on several other variables such as accessibility and mechanical loading. It is currently unknown exactly how rapidly defects could lead to failures as they are proactively managed to avoid failure where possible.
Desired Outcome
Establish or determine, with a degree of statistical confidence, the relationships between types of defects (from Stage 1) and failures (Failure event records). Once that is established, an age based probability of failure (failure rate function or survivor curve) would be derived.
Data Available
- Probability of failure or defect curves – from Stage 2
- Asset information on conductor age, type, construction, corrosive environment factor, condition scores, length and electrical loading
Problem Specification
Our future state asset health models need to consider the latest condition assessments, environmental effects, asset type and many other factors and based on these factors it estimates or forecasts a probability of failure.
Desired Outcome
Assess the relationship between multiple factors and the probability of failure – considering some factors may be linear while others are non-linear to derive a mathematical model or equation that estimates the resulting probability of failure.
Asset Photos
The following photos show examples of transmission line conductors with defects.
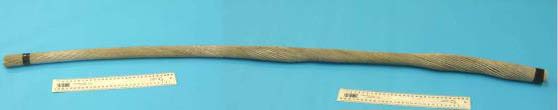
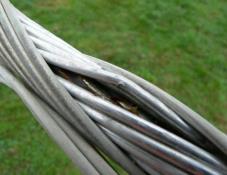
Figure 1: Sample of conductor showing two bulges that are relatively large, but extremely difficult to see in span from ground.
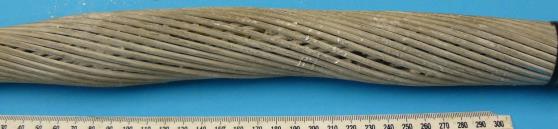
Figure 2: Close-up of bulge 1 (the right-hand bulge of the previous photo)
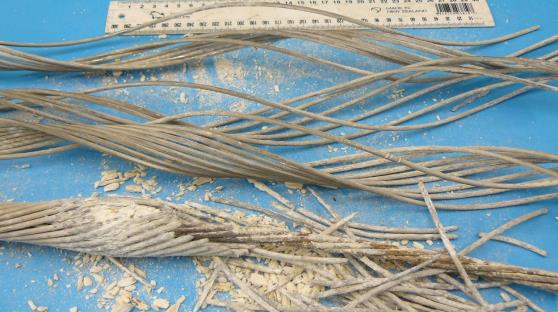
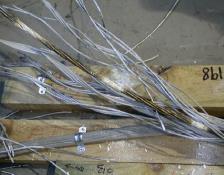
Figure 3: Bulge 1 after removal of the outer layer of aluminium strands, showing the extent of internal damage of aluminium wires
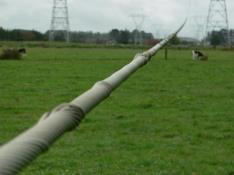
Figure 4: Grease holiday photos
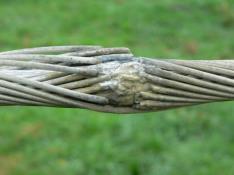
Severe corrosion bulge at 'grease holiday'
Adjacent conductor with good grease
Multiple grease holiday bulges
Core exposed and no grease (white patches)